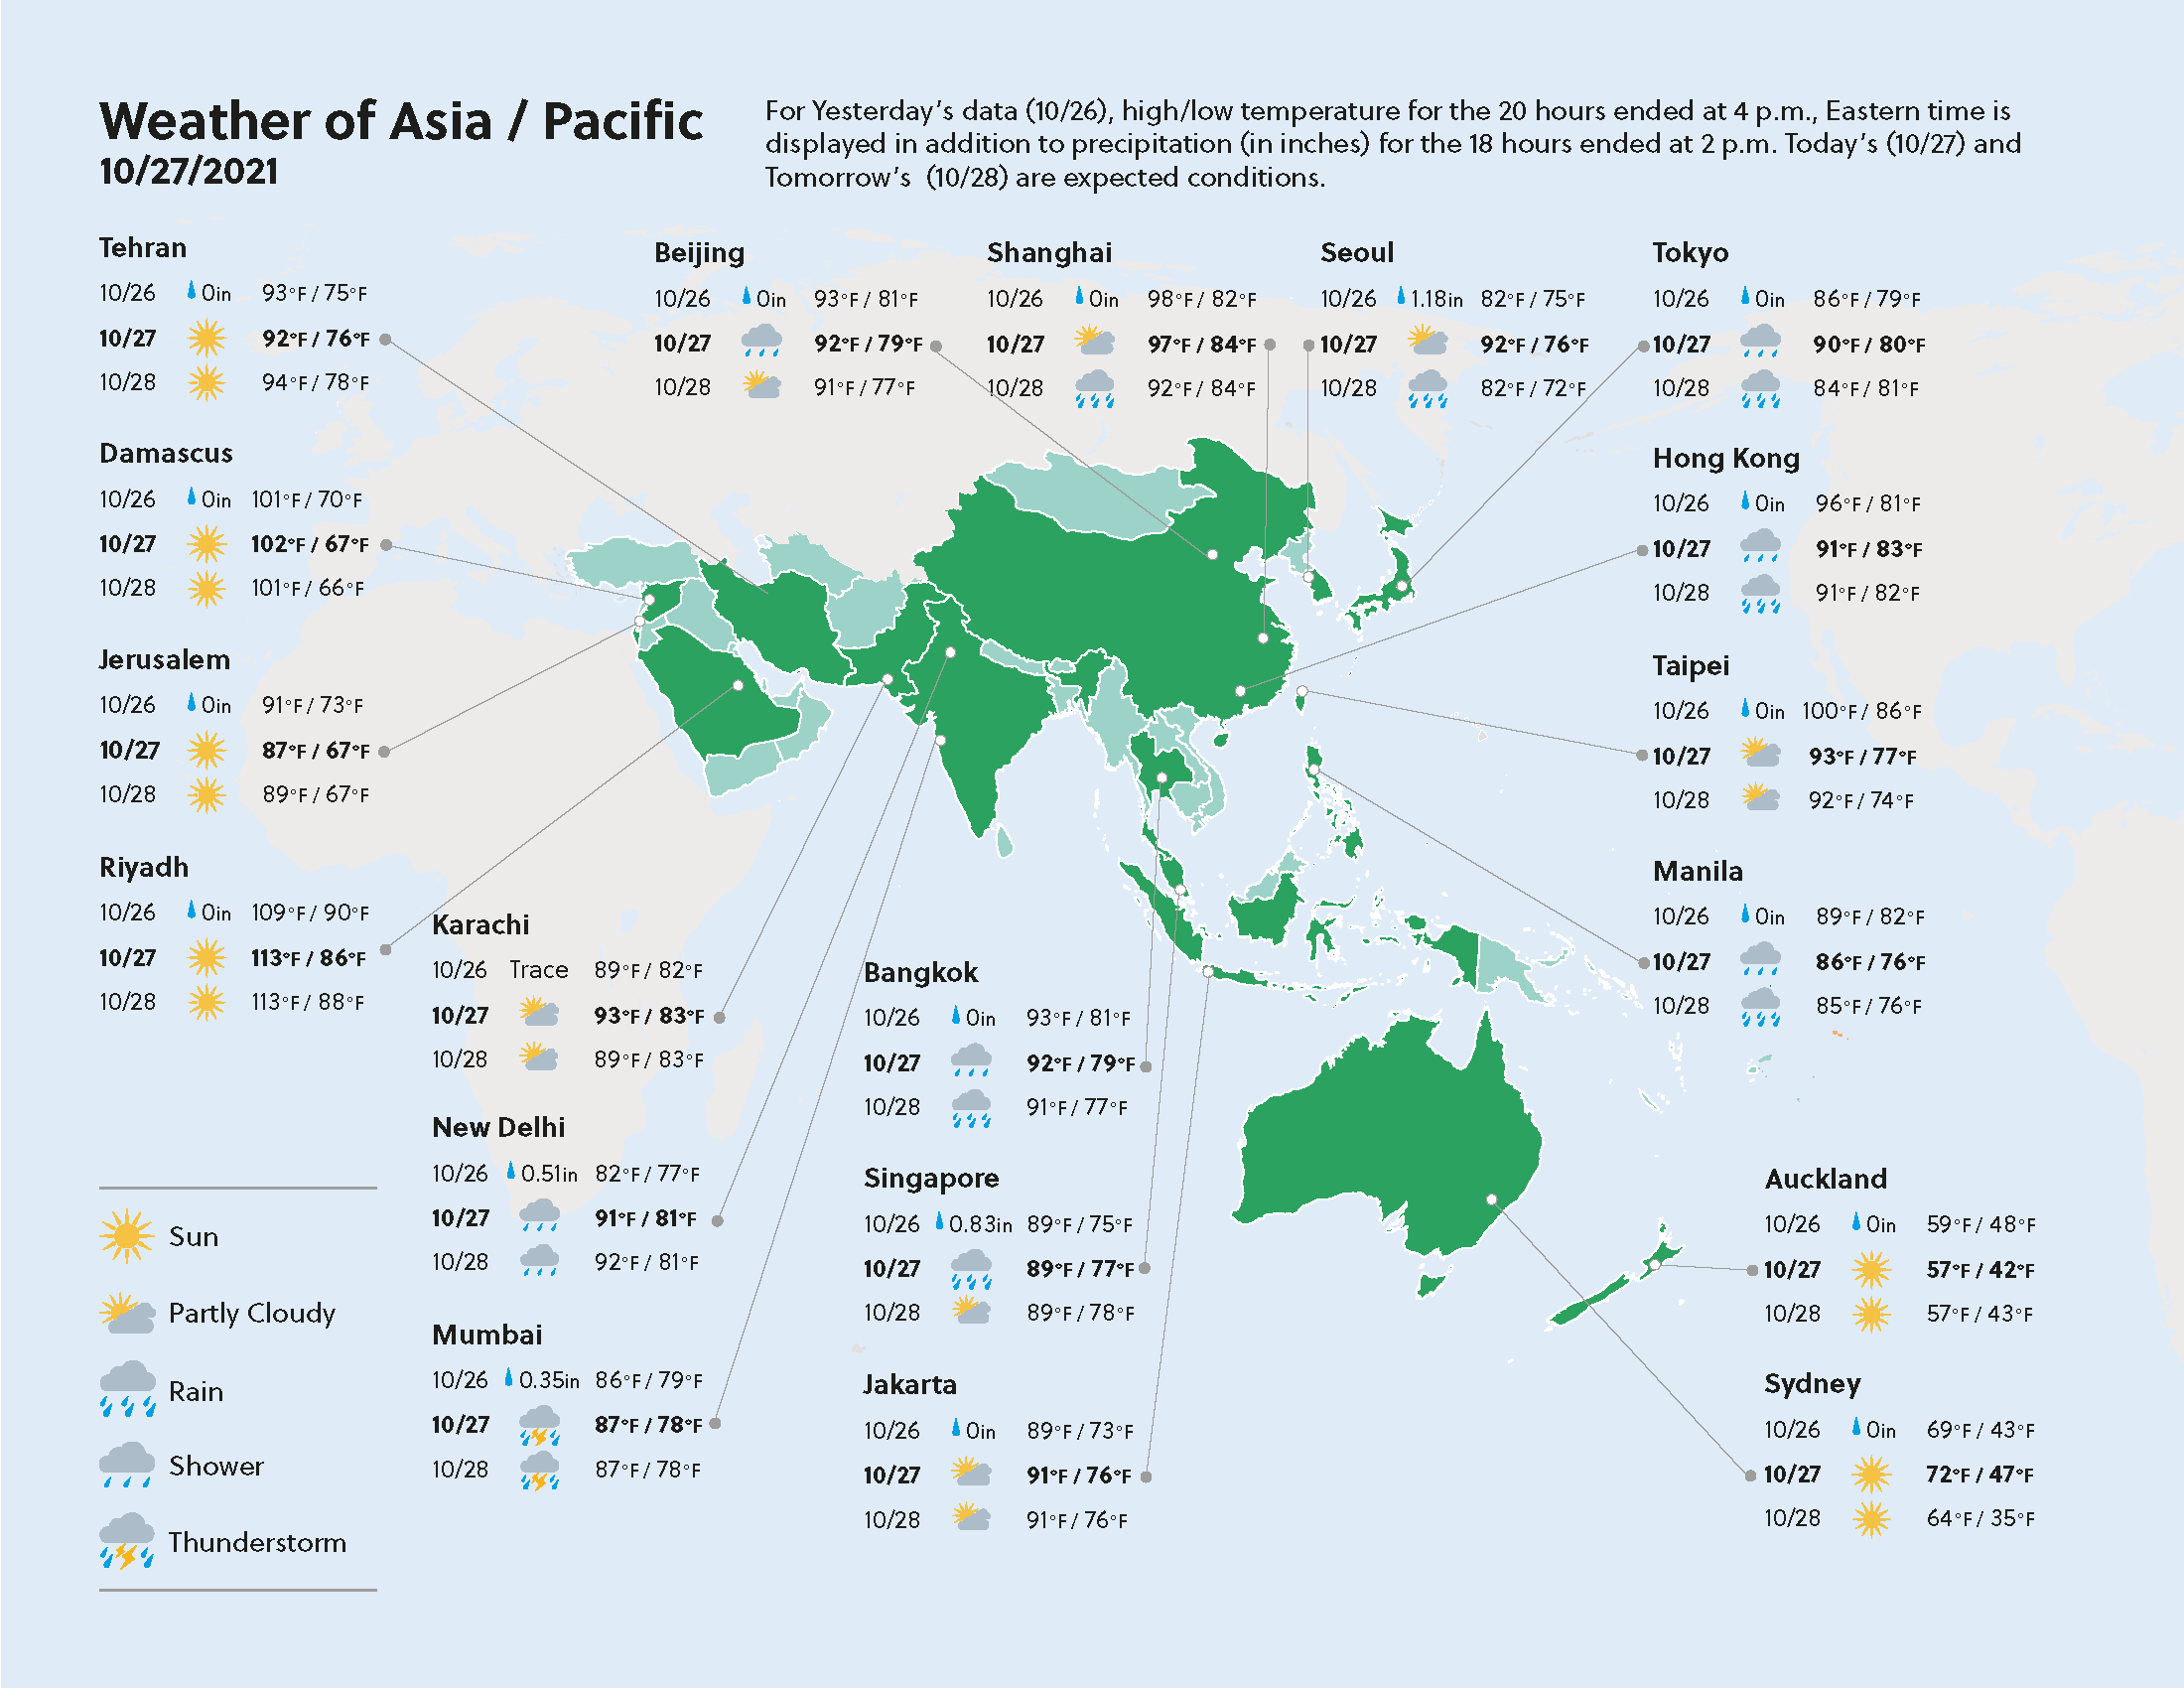
Imagery : Weather Matrix
One week project in October 2021 (in Chicago)
IIT Institute of Design (Educational purpose)
Visual representation of data to assist easy search, based on Asia-Pacific weather data provided to the class
Course - Introduction to Visual Communications
This course provides the fundamentals for conveying visual information in a way that is effective and clear. Through a deep understanding structure and context of content, we learned to apply visual elements, techniques, and principles crafting effective visual messages.
For this assignment, we were tasked to organize the word-based weather information in the Asia/Pacific and visually communicate it on a 11in*17in page.
My Role
Communication Designer
Instructor
Tomoko Ichikawa
Jody Campbell
Intent
I intended to make this poster for travelers who want to check today's weather at their destinations. Therefore, I lay information geographically so the audience can easily find the area they are looking for. In addition, I tried to use the callouts effectively to specify the city's location on the map because not all the cities were listed in the given data. Also, I intended to utilize the imagery(geographical map, icons) to communicate the data more intuitively.
Approach
First of all, I sketched out my idea and created just a part of the map with InDesign and Illustrator. After getting feedback from our instructors and classmates, I tried to finalize the high fidelity poster.
Outcome
Finalizing the visuals based on the feedback
Below is a finalized poster!

